In our lab, people rarely work alone - we collaborate a lot with each other as well as with external researchers and our industry partners.
FUDA Profiler (Tracer)
FUDA Profiler is used to collect all interactions (calls and callbacks) between the application and the framework API when a concept of interest is invoked at runtime. The collected traces are then automatically analysed by the FUDA Analyzer to generate concept-implementation templates.
Flash Demonstration
A flash demonstration of FUDA Profiler for the purpose of collecting a trace in the Eclipse environment can be found here
Screenshots
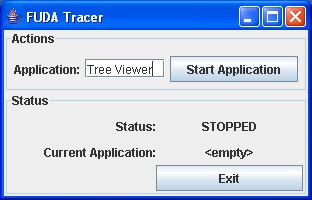
1. User names the trace (e.g., Tree Viewer). Pushes the Start Application button to put the FUDA Profiler in the recording mode. Then, opens the sample application.
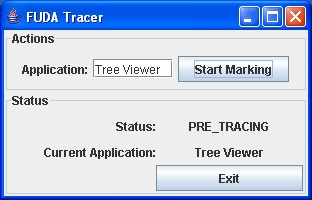
2. User clicks on the Start Marking button to put the FUDA Profiler in the marking mode. Then, invokes the desired concept in the sample application.
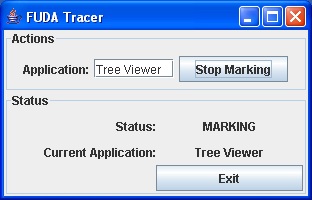
3. When the job of the desired concept is done, user presses the Stop Marking button to finish marking the trace.
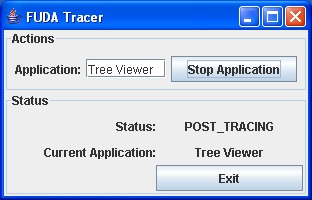
4. User closes the sample application. Next, pushes the Stop Application button to stop recording. Then, exits from the FUDA Profiler by pressing the Exit button.